
Need to convince people to go Agile?
Try the Agile Gantt chart!
I know, I know. When working with Agile and trying to be Agile, you normally don’t want to plan your work the way that old Gantt charts are built to handle. You just don’t want to go into so much detail (guessing) long before things have actually happened. Doing so is the opposite of being Agile. I know that and I very much recommend working with Agile.
But…
If a medium-to-large size company is trying to introduce Agile methods and processes in a serious way and really want to transition from classic methodology to Agile, it is a good idea to understand the history so that you can convince people in a factual manner and more easily see and explain where problems might arise.
It is important to be able to explain why some some classic methods and tools (like Gantt charts) may not work as well as some people think. To just dismiss all the processes and tools that people have previously worked with and say negative things like ’waterfall is bad’, without actually being able to explain things is often not a good idea if you really want to convince the sceptics. It is not unusual for employees that have lots of experience from using classic methods and tools to express doubt about how things work without what is perceived as proper planning and planning tools, such as Gantt charts. In such situations, it is not a good idea to just say that ”We can’t – and we don’t want to – plan ahead”. Instead, We need to talk about things in a way that everyone can understand, so that everyone involved can start working together instead of constantly debating things. So how can we discuss transitioning to Agile from classic planning and tools like Gantt charts without getting stuck in semi-religious arguments for and against Agile? Here is where the Agile Gantt chart might help. It can help clarify and simplify discussions around Gantt charts vs Agile and why detailed planning doesn’t work well in a modern software development environment. So, if someone still wants to plan ahead and use Gantt charts – show them the Agile Gantt chart and they might actually understand why Gantt charts often create a false sense of having things under control.
The problem with classic Gantt charts
A Gantt charts can be a great tool if used correctly, in the right context and with the correct prerequisites and attitudes. Lots of ifs there. The classic Gantt charts are mainly used for two purposes: The first purpose is to create a visual snapshot of our planning as we see it right now, including what it has been like over the last weeks or months. The second (and not so good) purpose is to visualise a planned course of action and, in effect, planned prioritisation, despite the fact that everything related to our future course of action and our future priorites is mainly guesswork. We are visualising guesses, but they look darn nice, almost like facts. Straight lines, nice bars and boxes. Still guesses though – even bordering on lies sometimes.
If you really know classic methodology and maybe even have had some training, you know that several classic methods actually recommend iterative work, i.e. re-planning as time goes and as reality changes. So, the main debate here shouldn’t be the need for iterative planning, because that was recommended years ago even in classic methods. The real issue is actually related to human behavior!
Humans just don’t want to re-plan too often, because it is a lot of work. The first planning took time and efforts – and the plan looks so nice now – so it’s only human to try to avoid having to do it all over again. To avoid all that re-planning work, people might start to blame the tools or the processes. People may start to have this hope of avoiding re-planning as a hidden agenda in discussions. Prestige and each individuals workload (don’t have time for re-planning) might be a part of it, too.
If we had used Agile methodology to begin with, we would have avoided big plans and thus there would be no need for re-planning when reality rears its ugly head.
Enough with the build-up!
Ok, let’s get on with it. So how can we show in a Gantt chart that classic Gantt charts don’t work well in modern software development?
What if…
Wouldn’t it be great if Gantt charts could be modernized and used to show that estimates for on-going or immediate work are more relevant and have a much higher likelihood of being correct than estimates for anything that is not as thoroughly discussed or is further away into the future? Well, now they can!
In this example, simple colour coding is used to symbolise the quality of knowledge, stories and estimates and therefore, in effect, the quality and the accuracy of the whole planning.
Team A uses classic Gantt thinking with nice, square bars that sit side by side, which looks nice. Team B on the other hand, uses an Agile Gantt chart, which may look weird but actually reflects reality better.
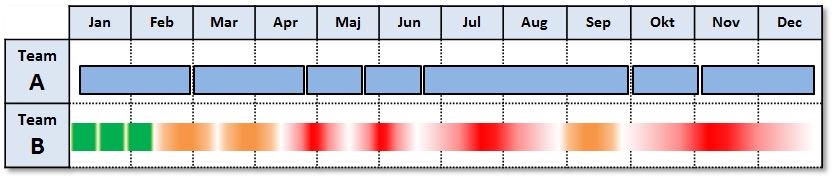
- Red = Not yet estimated or very preliminary estimates (maybe just guesswork)
Only a fraction of the red symbols are filled, which shows that we know very little about the contents of that epic/story/task/thing. Also, the ends are blurry, meaning that there is a lot of uncertainty in the total amount of time needed. It’s even hard to tell exactly where that red bar starts and ends, meaning we can’t even be sure what the start and the end of that effort looks like. - Orange = Medium-quality estimates
Only parts of the orange bar is filled, meaning we don’t know enough about the contents. The bar ends are blurry too, but not as blurry as with the red bars. - Green = Thoroughly discussed, higher quality estimates
Almost no blurriness, More certainty. Estimates are relevant. We can go ahead and use these estimates as long as we remember that they are estimates. At least we did our best when we created them. Only green bars can be used in high-level discussions around when the work for a particular epic/story/task/thing will be done.
Can we turn red and orange bars into green bars?
Oh yes! If the team can get enough information and enough time to discuss and try some ideas, then both the red and the orange bars can be turned into green bars simply because the team and their product owner (assuming Scrum is used) now understand the contents of the bars and feel more confident when estimating them. It is also possible that each red or orange bar may become more than one green bar. It is also possible that a number of things must be done before the team can even begin to work on turning red/orange bars into green bars.
..but hang on a second! The time needed to work on stuff so that we understand all those red/orange bars (the work we foresee) better is also work, but that work wasn’t represented by any bars, was it? We are on to something here.
The problem is that we can never correctly represent the work we need to do if we use very clear and square Gantt bars or numbers in Excel sheets or whatever else – those tools just don’t correctly reflect the reality we work in!
So what is the conclusion here?
Coming up with good, useful estimates takes time. That time in itself is also work. If the team for some reason cannot spend enough time investigating stuff and trying ideas, then the estimates they come up with may be of low quality and of little use. This is why some organisations have stopped estimating stuff.
Now that we have seen how much uncertainty can be hidden in the nice, square, easy-to-draw bars in a Gantt chart, it starts to become clear that long term planning based on those bars cannot be done in any detail and may become more and more incorrect (very soon completely incorrect) the further away into the future they are.
By now, you hopefully have some more arguments if you need to convince people that Agile planning reflects reality better than classic Gantt charts do. Agile Gantt charts, however, may be useful visualisation tools in Agile environments, since they clearly show that only green bars in the near future are of any use when planning.
Good luck!
(If you found this text useful, you may also like the post about the quality barometer. )